Saturday, March 21, 2026
Home Blog Page 7

Bitcoin sinks below $69,000 as US job market unexpectedly shed 92,000 jobs in February

0


Bitcoin dropped from above $70,000 to about $68,700 on Friday on disappointing US labour market data.

Nonfarm payrolls fell by 92,000 in February, markedly undershooting economists’ expectations for roughly 50,000 new jobs, according to the Bureau of Labor Statistics.

The decline erased much of January’s 126,000 job gain and pushed the unemployment rate up to 4.4%.

Job losses were broad-based, including reductions in healthcare employment due to strike activity, as well as declines in the technology sector and continued cuts in federal government jobs.

The weak report reinforces concerns about the health of the labor market after a slow 2025 marked by average monthly job gains of just 15,000.

Financial markets reacted to the disappointing figures with a shift toward safer assets.

US Treasury yields fell sharply, while investors increased expectations that the Federal Reserve may need to lower interest rates if economic weakness continues.

The US dollar slipped about 0.3% against the euro, and S&P 500 futures dropped more than 1%.

Despite the weak data, economists said the Fed is unlikely to cut rates immediately, noting that policymakers remain cautious amid persistent inflation risks and rising oil prices linked to geopolitical tensions.

Disclosure: This article was edited by Vivian Nguyen. For more information on how we create and review content, see our Editorial Policy.


Oil tops $90 for the first time as Iran tensions deepen

0


Oil prices surged Friday, with Brent crude topping $90 per barrel for the first time since the latest escalation of geopolitical tensions in the Middle East.

The rally came as US President Donald Trump warned there would be no agreement with Iran, posting on Truth Social that the only acceptable outcome would be “unconditional surrender.”

The statement added to concerns that the conflict could continue escalating, increasing the risk of supply disruptions across the global energy market.

According to a report by Financial Times, Qatar’s energy minister Saad al Kaabi warned that the ongoing war in the Middle East could severely disrupt global energy markets and potentially push oil prices as high as $150 per barrel.

Analysts say markets may have underestimated how long the conflict could last, with traders beginning to price in the possibility of a prolonged war.

Energy supply concerns have also intensified across the region. Iraq has already shut down most of its oil production, while Kuwait could follow in the coming days as storage facilities approach capacity. Analysts have also warned that Saudi Arabia, the Gulf’s largest producer, could eventually face pressure to reduce output.

Brent crude rose nearly 7% to $91.33 per barrel Friday, up sharply from around $72 before the conflict began. US benchmark West Texas Intermediate climbed about 13% near $89 per barrel.

The surge in oil prices rattled broader financial markets, pushing risk assets lower. Bitcoin fell roughly 3% on the day, trading near $68K, while equities also declined, with the S&P 500 down about 1% and the Nasdaq falling 1.1%.

Disclosure: This article was edited by Estefano Gomez. For more information on how we create and review content, see our Editorial Policy.


Oil jumps as Trump Iran warning and weak jobs data rattle markets

0


Markets got hit from both sides on Thursday. Geopolitical saber-rattling pushed oil to $88 a barrel, and then a brutal jobs report kicked risk assets while they were already down.

Bitcoin dropped 3.7% in 24 hours to around $69K. Ethereum fared worse, sliding 4.2% to slip below the psychologically important $2K level. Solana took the hardest punch among major tokens, falling 5% to roughly $85. The crypto Fear & Greed Index now sits at 18 — deep in “Extreme Fear” territory, barely improved from last week’s 13.

The geopolitical trigger

Former President Trump posted on Truth Social that Iran must accept “unconditional surrender.” Those two words sent oil traders scrambling.

West Texas Intermediate crude jumped to $88 per barrel as the market priced in potential disruptions to the Strait of Hormuz — the narrow waterway through which roughly 20% of the world’s oil supply passes daily. Think of it as the global economy’s jugular vein, and someone just waved a knife near it.

An $88 oil price isn’t catastrophic by historical standards. Crude topped $120 in June 2022 after Russia’s invasion of Ukraine. But direction matters more than absolute level. When oil spikes suddenly on geopolitical risk rather than demand strength, it functions as a tax on consumers and a headwind for corporate margins simultaneously.

Higher energy costs feed directly into inflation expectations. And inflation expectations are the one thing the Federal Reserve absolutely does not want moving in the wrong direction right now.

A jobs report nobody wanted

If the oil shock was the left hook, the employment data was the right cross.

The US economy shed 92,000 jobs last month. Wall Street had expected a gain of 59,000. That’s not just a miss — it’s a 151,000 swing in the wrong direction. In English: economists predicted modest hiring, and instead got significant layoffs.

To put that gap in context, a miss of this magnitude is relatively rare outside of recession periods. The last time payrolls came in more than 150,000 below consensus was during the initial COVID shock in early 2020. This isn’t that, but the comparison isn’t exactly comforting either.

The combination is particularly toxic for markets. Rising oil prices suggest inflation pressures are building, which argues against rate cuts. Falling employment suggests the economy is weakening, which argues for rate cuts. The Fed can’t easily address both problems at once. That’s the textbook definition of a stagflationary signal, and it’s the macro scenario that gives portfolio managers nightmares.

Crypto’s correlation problem

Bitcoin was supposed to be the uncorrelated asset. The digital gold. The hedge against exactly this kind of macro chaos.

Instead, BTC fell in lockstep with equities. Again. The correlation between Bitcoin and the S&P 500 has been stubbornly persistent throughout 2024 and into 2025. When institutional money dominates crypto flows — through spot ETFs, treasury allocations, and prime brokerage desks — the asset class behaves like a high-beta tech stock, not a safe haven.

The damage was spread broadly across the crypto market. XRP settled around $1.36, and even the broader altcoin landscape showed deep red. The one notable exception: US Treasury-backed stablecoins, which posted a 28.9% gain over the past seven days as capital rotated aggressively into the safest possible on-chain parking spot. When stablecoins are your best-performing category, the market is essentially telling you it wants to sit this one out.

There’s a silver lining buried in the weekly data, though. Bitcoin is still up 4% over the past seven days despite Thursday’s selloff. That suggests the broader trend hadn’t fully reversed — at least not yet. Whether that weekly gain survives another session or two of risk-off trading is the key question.

What this means for investors

The immediate risk is a feedback loop. Higher oil prices erode consumer spending power, which weakens employment further, which reduces spending again. If Friday brings more hawkish commentary from Fed officials responding to the inflation signal while ignoring the jobs weakness, expect another leg down in risk assets.

For crypto specifically, the $69K level for Bitcoin is worth watching closely. It sits near the previous cycle’s all-time high from November 2021, which many technical analysts view as a major support zone. A sustained break below $67K would likely trigger a cascade of leveraged liquidations and could send BTC toward the mid-$60K range.

Ethereum below $2K is similarly precarious. That level has been a battleground multiple times in 2025, and each test weakens buyer conviction. Solana at $85 is trading well below its 2024 highs and approaching levels that could shake out the remaining momentum traders.

The Fear & Greed Index at 18 does offer one contrarian signal. Historically, readings below 20 have preceded meaningful rallies — not immediately, but within weeks. Extreme fear tends to mark zones of capitulation where weak hands exit and patient capital accumulates. The caveat is that this only works if the macro backdrop stabilizes. A Fear & Greed reading of 18 during a genuine stagflationary episode could easily become a 10.

Investors should monitor three things in the coming days: whether oil continues climbing toward $90 and beyond, whether the next round of economic data confirms or contradicts the jobs weakness, and whether Bitcoin can hold its weekly gains. Two out of three going the wrong way would significantly raise the probability of a broader correction.

Bottom line: Geopolitical risk and economic weakness arriving simultaneously is the macro cocktail that markets hate most. Crypto proved once again that it trades as a risk asset during stress events, not a hedge against them. The Fear & Greed Index screaming “Extreme Fear” could be a buying signal or a warning — and which one depends entirely on whether the next few data points suggest this is a bad week or the start of something worse.

Disclosure: This article was edited by Estefano Gomez. For more information on how we create and review content, see our Editorial Policy.


Oil jitters and macro headwinds weigh on crypto markets as fear index hits extreme lows

0


When oil prices sneeze, risk assets catch pneumonia. Crypto is currently reaching for the tissues.

Prediction market Polymarket now shows a record 73% probability that US oil prices will breach $90 per barrel this month — a level not seen since October 2023. Bitcoin responded by slipping below $71K, while the broader crypto Fear & Greed Index sits at a grim 18, deep in “Extreme Fear” territory.

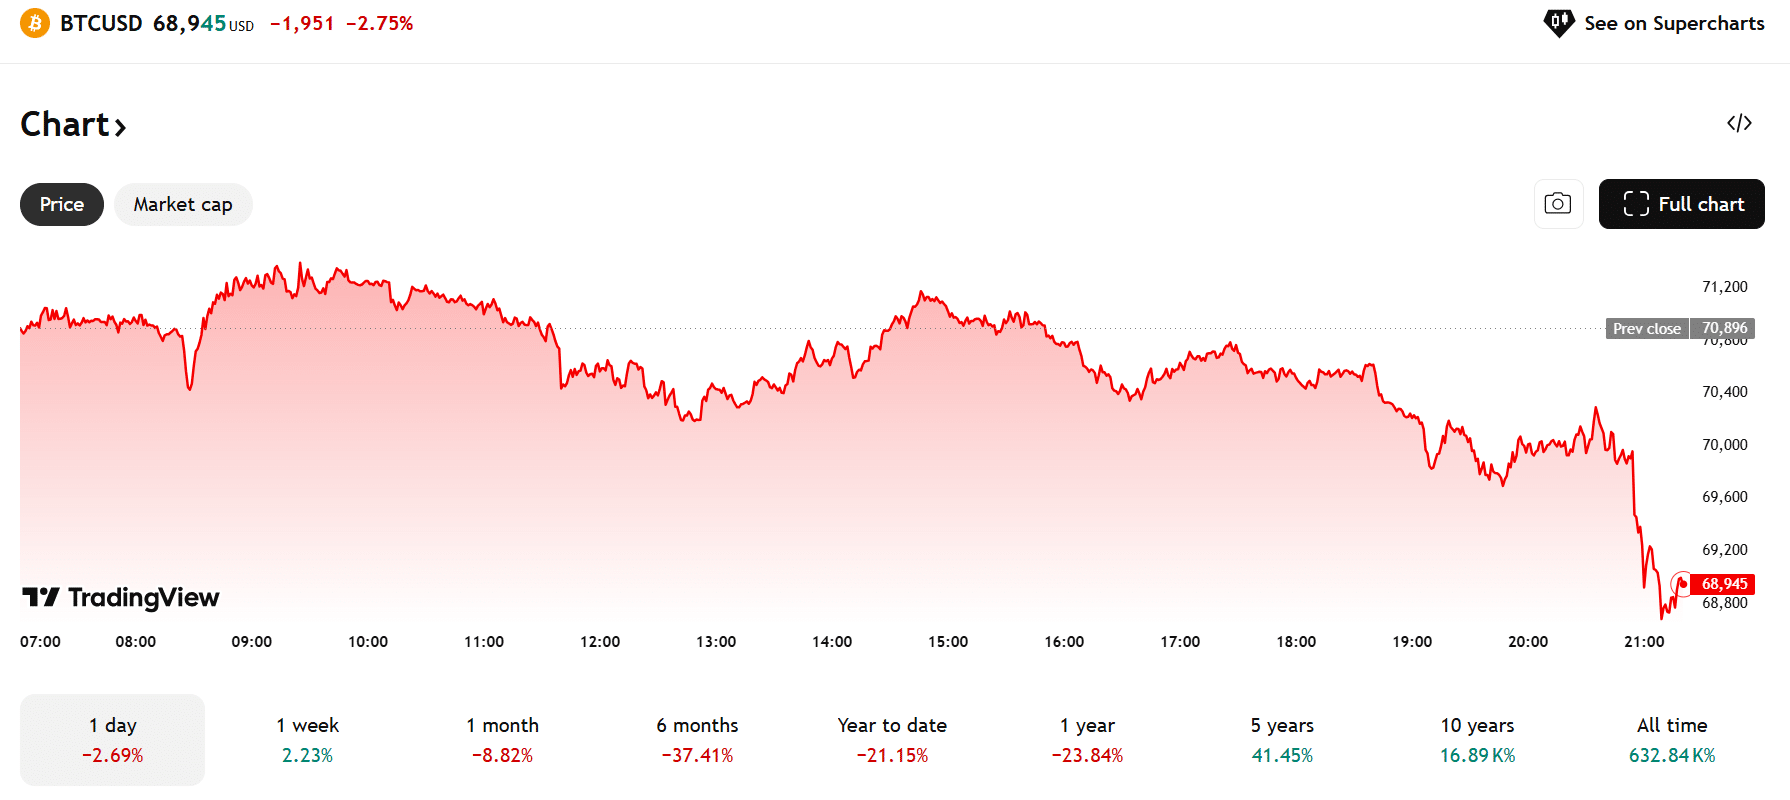
The numbers tell a painful story

Bitcoin dropped 2.6% over the past 24 hours, trading below the $71K mark that bulls had been defending. The weekly picture is slightly less bleak — BTC is still up 4.3% over seven days — but the daily momentum clearly belongs to the sellers.

Ethereum fared no better, shedding 2.5% to drift near $2,075. That’s a psychologically important zone for ETH holders who remember the asset comfortably sitting above $3,000 not long ago.

Solana took the hardest hit among major assets, falling 3.0% to slide toward $88. XRP settled around $1.40, joining the broader retreat without much fanfare.

The Fear & Greed Index reading of 18 is worth sitting with for a moment. Last week it was 13 — also “Extreme Fear.” So technically, sentiment has improved. Going from “apocalyptic dread” to merely “extreme dread” isn’t exactly a victory lap, but it’s something.

Why oil matters for your crypto portfolio

The connection between crude oil and digital assets might not seem obvious at first glance. Bitcoin doesn’t run on diesel. Ethereum validators don’t need gasoline. But the relationship is real and runs through a pretty straightforward chain of logic.

Rising oil prices feed directly into inflation expectations. When energy costs climb, everything from shipping to manufacturing gets more expensive. That cost pressure flows through to consumer prices, which is precisely what the Federal Reserve watches when deciding interest rate policy.

In English: expensive oil makes the Fed less likely to cut rates, and crypto loves rate cuts.

The $90-per-barrel threshold is particularly significant because it represents a psychological barrier the market hasn’t tested in roughly 18 months. If Polymarket’s 73% probability proves correct, it would signal a meaningful shift in the energy landscape that could ripple through every corner of financial markets.

Higher energy costs also directly impact Bitcoin mining operations, squeezing margins for an industry already navigating post-halving economics. When it costs more to run the machines that secure the network, miners face uncomfortable choices — absorb the losses, sell more Bitcoin to cover costs, or shut down unprofitable rigs. None of those options are particularly bullish.

The macro backdrop extends beyond just oil. Global trade tensions remain elevated, and several major economies are showing signs of slowing growth. When institutional investors get nervous about the broader economic picture, they tend to reduce exposure to volatile assets first. Crypto, for better or worse, still sits squarely in that category for most traditional portfolio managers.

What investors should watch from here

The extreme fear reading is a double-edged sword, and experienced market participants know it. Historically, periods of maximum pessimism in the Fear & Greed Index have often preceded significant rallies. The classic Warren Buffett playbook of being greedy when others are fearful has worked in crypto markets multiple times — but it requires genuine conviction and an iron stomach.

That said, there’s an important distinction between fear driven by sentiment and fear driven by structural macro forces. The current anxiety has real economic fundamentals behind it. Oil prices don’t care about crypto Twitter’s mood. If energy costs genuinely surge past $90 and stay there, the pressure on risk assets could persist well beyond a typical sentiment-driven dip.

One bright spot buried in the data: the Morpho Ecosystem category surged 63.9% over the past week, according to CoinGecko. It’s a reminder that even in broad market downturns, specific narratives and niches can dramatically outperform. Investors who focus exclusively on BTC and ETH price action might miss rotations happening beneath the surface.

The key variable to monitor is whether oil actually breaches and holds above $90. Prediction markets are useful gauges of consensus expectations, but they’re not crystal balls. If oil stalls below that level, the fear premium currently baked into crypto prices could unwind quickly. If it blows through $90 and heads toward $95 or $100, expect the current drawdown to deepen.

Bitcoin’s ability to hold the $70K level will be the most important technical signal in coming days. A decisive break below that round number could trigger a cascade of liquidations and stop-losses that accelerate selling pressure. Conversely, a strong bounce from current levels would suggest buyers view this as a macro-driven dip worth buying.

Ethereum’s positioning near $2,075 puts it in a similarly precarious spot. The $2,000 level has served as significant support multiple times, and a test of that zone feels increasingly likely if the macro picture doesn’t improve.

For Solana, the decline toward $88 comes after a period of relative strength in its ecosystem metrics. Network activity and developer engagement have remained solid, which creates an interesting divergence between on-chain fundamentals and price action. That kind of disconnect tends to resolve — the question is which direction.

Bottom line: Crypto markets are caught in a macro vice grip where rising oil prices, stubborn inflation fears, and extreme sentiment readings converge to create genuine uncertainty. The Fear & Greed Index at 18 suggests plenty of pain is already priced in, but with Polymarket’s oil call at record conviction levels, the external pressure may not be done yet. Sometimes the smartest move in extreme fear is patience — not panic, but not premature heroism either.

Disclosure: This article was edited by Estefano Gomez. For more information on how we create and review content, see our Editorial Policy.


Geopolitical tensions drag crypto lower as Middle East conflict escalates

0


War has a way of clarifying what traders actually believe about risk assets. Six consecutive days of US and Israeli airstrikes targeting sites across Iran have sent shockwaves through global markets, and crypto — despite its growing reputation as a macro hedge — is getting dragged down with everything else. Bitcoin slipped below $72K, Ethereum drifted near $2,100, and Solana fell under $90 as capital fled toward traditional safe havens like gold and US Treasuries.

The broader picture is getting worse, not better. Kurdish opposition groups are now signaling potential ground operations across Iran’s borders, a development that would mark a significant escalation beyond the aerial campaign. For a market already on edge, that kind of threat is enough to keep risk appetite firmly suppressed.

The numbers tell the story

Bitcoin dropped roughly 3.1% over the past 24 hours, settling below the $72K level that had served as a support zone during the previous week’s recovery. That weekly context matters: BTC is still up about 5.7% on a seven-day basis, meaning much of this sell-off is erasing gains from what had been a cautiously optimistic stretch.

Ethereum fared somewhat worse, shedding 3.9% in the same period to hover around $2,100. Solana took the hardest hit among major tokens, declining 4.4% and falling below $90 — a psychologically significant level that bulls had fought to defend during prior sell-offs this year.

The Fear and Greed Index, tracked by Alternative.me, currently reads 22, squarely in “Extreme Fear” territory. For context, it was at 11 just last week — meaning sentiment has actually improved slightly from truly apocalyptic levels, even as prices are moving lower. That divergence is worth noting: sometimes sentiment bottoms before price does, and sometimes it just means the market hasn’t fully processed the latest bad news yet.

Not everything is bleeding, though. The Morpho Ecosystem category posted a striking 63.1% gain over seven days, according to CoinGecko data, proving that even in a fearful market, pockets of DeFi continue to attract speculative capital. Whether that’s genuine conviction or simply traders looking for uncorrelated returns in a sea of red is an open question.

A familiar pattern with unfamiliar stakes

Crypto’s relationship with geopolitical shocks has been inconsistent at best. During Russia’s initial invasion of Ukraine in February 2022, Bitcoin dropped roughly 8% in the first 48 hours before staging a partial recovery. When Iran and Israel exchanged missile fire in April 2024, BTC sold off sharply but recovered within days once the situation appeared contained. The pattern tends to follow a script: initial panic selling, a brief period of uncertainty, then a recovery once markets conclude the worst-case scenario has been avoided.

This time, however, the worst-case scenario keeps getting updated. What began as targeted strikes has now stretched into nearly a week of sustained military operations, with the possibility of ground incursions adding another layer of unpredictability. Oil prices have spiked in parallel, which feeds into inflation expectations, which in turn makes central banks less likely to cut rates — a chain reaction that hits risk assets at every link.

The narrative that Bitcoin functions as “digital gold” or a geopolitical hedge gets tested in moments exactly like these. So far in 2025, the evidence is mixed. Bitcoin has outperformed most tech stocks during the drawdown, but it is still declining in absolute terms alongside equities. The asset that is supposed to be uncorrelated keeps correlating when it matters most.

What this means for investors

The key variable to watch is not the crypto market itself — it is the military and diplomatic trajectory in the Middle East. If the conflict remains limited to airstrikes and the ground operation threat fizzles, history suggests crypto could snap back relatively quickly. The 5.7% weekly gain Bitcoin posted before this latest sell-off shows there is underlying demand waiting for a reason to return.

If, however, Kurdish ground forces do cross into Iran, the escalation would be qualitatively different from anything the region has seen in years. That scenario would likely push oil above $100 per barrel, reignite inflation fears globally, and potentially force the Federal Reserve to delay or reverse any rate-cutting plans it had signaled. For crypto, that macro environment is poison — it removes the liquidity tailwind that has driven most of the gains in risk assets since late 2024.

Traders with a longer time horizon might view the Extreme Fear reading of 22 as a contrarian signal. Historically, buying when the index dips below 25 has produced positive returns over 90-day windows more often than not. But that statistical tendency comes with a massive caveat: it assumes the underlying macro conditions eventually stabilize. If the geopolitical situation deteriorates further, those historical patterns become unreliable at best and dangerous at worst.

For those already positioned in crypto, the prudent move is likely to monitor exposure rather than panic sell into a drawdown that may be temporary. For those looking to enter, the $72K level on Bitcoin is worth watching closely — a decisive break below it could open the door to the mid-$60K range, while a defense and bounce would suggest the market has already priced in the current level of conflict.

Bottom line: Geopolitical risk is the one variable that crypto markets still have no good framework for pricing. With the Fear and Greed Index at 22 and bombs still falling, the market is essentially admitting it does not know what happens next. That uncertainty, rather than any specific price level, is what makes this moment particularly treacherous for anyone trying to trade around it.

Disclosure: This article was edited by Estefano Gomez. For more information on how we create and review content, see our Editorial Policy.


Trade war jitters drag crypto lower across the board

0


Crypto markets are bleeding red again, and this time the catalyst has nothing to do with blockchain. A widening gap between US trade rhetoric and actual Chinese purchasing behavior has rattled investors across every asset class, dragging Bitcoin below $72K and sending the Fear and Greed Index deep into “Extreme Fear” territory at 22.

The selloff comes as US farmers report zero Chinese purchases of American soybeans since late 2025, directly contradicting Washington’s push to get Beijing buying more agricultural products and Boeing jets as part of trade de-escalation efforts. When the world’s two largest economies can’t close a soybean deal, crypto traders apparently take notice.

The damage report

Bitcoin dropped 2.9% over the past 24 hours, slipping below the $72K level that many traders had been watching as near-term support. The move is particularly jarring given that BTC was actually up 5.9% on the week before the latest leg down, suggesting the trade news erased several days of gains in a matter of hours.

Ethereum fared worse, shedding 3.6% to hover near $2,100. That price level puts ETH roughly 57% below its all-time high from late 2021, a painful reminder of how far the second-largest crypto asset remains from its peak despite years of network upgrades and institutional adoption narratives.

Solana took the hardest hit among major tokens, dropping 4.4% to fall under $90. The pattern is familiar: in risk-off environments, higher-beta assets tend to amplify whatever Bitcoin does, and SOL delivered on that expectation with precision.

The broader crypto market’s mood is captured neatly by the Fear and Greed Index, which sits at 22. That’s firmly in “Extreme Fear” territory, though it actually represents an improvement from last week’s reading of 11. In other words, the market was already terrified before the trade news hit — this just added another layer of anxiety to an already fragile sentiment picture.

Why soybeans matter for your Bitcoin position

The connection between Chinese agricultural imports and crypto prices might seem tenuous, but the transmission mechanism is straightforward. Trade tensions between the US and China act as a barometer for global economic health. When those tensions escalate — or when evidence suggests diplomatic progress is illusory — investors pull back from risk assets broadly.

This is not a new dynamic. During the 2018-2019 trade war, Bitcoin exhibited increasing correlation with equity markets during acute stress periods, a pattern that has only strengthened as institutional participation in crypto has grown. More hedge funds, more ETF holders, and more corporate treasury allocations mean more portfolio-level risk management decisions that treat crypto as part of a broader risk bucket.

The specific trigger here is notable. Washington has been publicly pressuring China to increase purchases of American goods — particularly soybeans and Boeing aircraft — as a confidence-building measure. But the reality on the ground tells a different story. US farmers, who serve as the most direct gauge of actual trade flows, report that Chinese buying has been absent since late 2025. That disconnect between political messaging and commercial reality is exactly the kind of signal that makes institutional investors nervous.

Traditional equities sold off in tandem, reinforcing the cross-asset correlation that crypto bulls often wish would disappear but rarely does during stress events. When the S&P 500 catches a cold, Bitcoin tends to sneeze right alongside it.

What investors should be watching

The immediate question is whether this dip represents a buying opportunity or the start of a deeper correction. The weekly chart offers some comfort: Bitcoin’s 5.9% gain over seven days suggests the broader trend was positive before the trade shock. If the soybean story proves to be a temporary scare rather than the opening chapter of a renewed trade war, a recovery toward $74K-$75K is plausible within days.

But the risks are asymmetric and tilted to the downside. An Extreme Fear reading of 22 means the market is already positioned defensively, which can cut both ways. Fearful markets can snap back violently on positive catalysts, but they can also cascade lower if negative headlines compound. A second data point confirming the absence of Chinese purchases — or worse, retaliatory tariff announcements — could push Bitcoin toward the $68K-$70K range that served as support earlier this year.

One curious bright spot buried in the data: the Morpho Ecosystem category surged 63.1% over the past week, a reminder that even in broadly bearish conditions, pockets of the market can move independently based on protocol-specific catalysts. For active traders, sector rotation within crypto remains viable even when the macro picture looks grim.

The competitive landscape among layer-1 tokens is worth monitoring closely. Solana’s 4.4% drop — nearly double Ethereum’s percentage decline — suggests that in this risk environment, the market is applying steeper discounts to chains perceived as having less institutional backing. If trade tensions persist, expect this divergence to widen, with capital gravitating toward Bitcoin and, to a lesser extent, Ethereum as relative safe havens within crypto.

Longer-term investors should watch for any concrete trade agreement developments between Washington and Beijing. The absence of Chinese agricultural purchases is a lagging indicator of diplomatic strain that may have been building for months. Until there is verifiable evidence of renewed trade flows — not just press conferences — the macro overhang on risk assets is likely to persist.

Bottom line: Stalled US-China trade talks are doing what they always do to risk assets — punishing them. Bitcoin’s slide below $72K alongside broad crypto weakness reflects a market that was already fearful and just got another reason to stay that way. The playbook here is patience: wait for either concrete trade progress or a washout to more compelling support levels before adding meaningful exposure.

Disclosure: This article was edited by Estefano Gomez. For more information on how we create and review content, see our Editorial Policy.


Poland’s central bank chief floats using gold-linked profits for $47B defense fund

0


Adam Glapiński, the governor of the National Bank of Poland, has reportedly proposed channeling central bank profits toward a 185 billion zloty (roughly $47B) defense fund — a sovereign alternative to borrowing from the European Union. The plan, which surfaced on March 4, would provide interest-free funding for Poland’s military buildup without adding a single zloty of external debt.

Headlines initially suggested Glapiński was weighing outright gold sales to pay for it. That framing sent a jolt through commodity and macro circles, given that Poland has spent the better part of a decade aggressively stockpiling bullion. But as of March 5, no confirmed plans to liquidate gold reserves exist. The real proposal appears more nuanced — and arguably more interesting.

What Glapiński is actually proposing

The core idea is straightforward: redirect NBP profits to fund defense spending domestically, sidestepping a proposed €44B EU loan program that would tie Poland to Brussels-imposed conditions. For a government that has frequently clashed with EU institutions over judicial independence and rule-of-law concerns, financial sovereignty is not an abstract concept — it is policy.

The 185 billion zloty figure is substantial. For context, Poland’s entire 2025 defense budget was around 186 billion zloty, meaning this proposal would effectively double the country’s military spending capacity over the funding period. That puts Poland on track to be one of the highest defense spenders in NATO relative to GDP, a status it has been steadily climbing toward since Russia’s full-scale invasion of Ukraine in 2022.

The mechanism likely involves the NBP retaining or reallocating profits that would otherwise flow to the state treasury as dividends. Central banks generate profits from interest on reserves, foreign exchange operations, and — crucially — revaluation gains on gold holdings. Poland’s gold has appreciated significantly over the past several years, meaning the NBP is sitting on substantial unrealized gains that could, in theory, be monetized without selling a single ounce.

This is where the gold narrative gets tangled. Revaluing gold reserves upward and using the resulting paper profits for fiscal purposes is a well-worn central banking maneuver. Italy and France have periodically flirted with similar schemes. It is not the same as dumping bullion on the open market, but it does raise questions about whether a central bank is effectively printing money with extra steps.

Poland’s gold rush in context

To understand why the mere whisper of Polish gold sales rattled observers, you need to appreciate the scale of Poland’s accumulation. In 2018, the NBP held just 103 tons of gold. By January 2026, that figure had ballooned to 550 tons — a more than fivefold increase that ranks Poland 11th globally among central bank gold holders, ahead of the UK and just behind the European Central Bank’s own reserves.

And Glapiński was not done. In January 2026, the NBP announced plans to purchase an additional 150 tons, which would bring the total to 700 tons. At current prices hovering near $2,900 per ounce, that target stash would be worth north of $65B — making Poland one of the top ten gold-holding nations on Earth.

This buying spree has been part of a broader trend among central banks globally. According to the World Gold Council, central banks purchased over 1,000 tons of gold in both 2023 and 2024, the highest sustained buying pace in decades. Poland has been among the most aggressive buyers in that cohort, alongside China, India, and Turkey.

So the idea that Glapiński would reverse course and start selling strikes most analysts as implausible. The more likely scenario is that he is leveraging the value of gold holdings — through profit reallocation or revaluation accounting — rather than the gold itself.

What this means for investors

For gold markets, the immediate takeaway is relief. A 550-ton holder turning seller would be a meaningful bearish signal, particularly at a time when central bank demand has been one of the primary supports for prices above $2,800. The confirmation that Poland intends to keep buying, not selling, reinforces the bullish structural case for gold.

For crypto investors, the implications are more indirect but worth tracking. Bitcoin has increasingly been positioned as “digital gold” — an uncorrelated store of value that benefits when confidence in fiat monetary management erodes. A central bank using accounting maneuvers to fund defense spending without legislative approval or external borrowing is exactly the kind of institutional behavior that Bitcoin advocates cite as a reason to hold non-sovereign assets.

That said, the direct transmission mechanism from Polish central bank policy to Bitcoin prices is thin. More relevant is the narrative layer. If other central banks begin adopting similar strategies — tapping unrealized gold gains to fund fiscal priorities — it could accelerate interest in tokenized gold products and commodity-backed stablecoins, which offer exposure to the same underlying asset without the opacity of central bank balance sheets. Projects like Paxos Gold (PAXG) and Tether Gold (XAUT), which together hold a market cap north of $1.5B, could see renewed attention.

The risk to watch is political. Glapiński’s proposal effectively allows the central bank to direct fiscal policy, blurring the line between monetary and governmental authority. If this model gains traction — particularly in countries with strained relationships with multilateral lenders — it could erode trust in central bank independence more broadly. That erosion tends to be good for hard assets, whether physical or digital.

There is also the question of whether the EU will view this maneuver as an end-run around fiscal discipline frameworks. Brussels has historically taken a dim view of creative accounting by member states, and a €44B loan rejection in favor of central bank profit diversion could trigger its own set of political consequences.

The bottom line: Poland is not selling its gold — it is trying to spend the profits from owning it. The distinction matters enormously for commodity markets, but the broader signal is one that gold bugs and Bitcoin maximalists can both appreciate: a mid-sized European nation is choosing sovereign self-funding over multilateral debt, and it is using hard assets as the foundation. Whether that is prudent central banking or a fiscal sleight of hand depends entirely on whom you ask.

Disclosure: This article was edited by Estefano Gomez. For more information on how we create and review content, see our Editorial Policy.